Life
What Sport Has the Most Injuries? Top 10 Sports Ranked
What sport has the most injuries? The honest answer depends on how I measure risk. If I look at total injuries, sports with huge participation numbers usually rise to the top. If I look at injury rate per game, practice, or athlete exposure, collision sports often look worse.
That difference matters. Recent US data shows that gym exercise, basketball, football, and cycling generate a very high number of ER visits. Yet football often leads by injury rate, especially in game settings. So, when I answer this question, I separate total volume from rate, because they are not the same thing.
Why this ranking changes from one source to another
I think of it like traffic. One road may have more crashes simply because more cars use it. Another road may be more dangerous per mile. Sports injuries work the same way.
That is why no single 2026 source gives one perfect top-10 list. Some reports focus on emergency room visits. Others look at youth sports, college athletics, or injuries per 1,000 athlete exposures. I found recent reporting on ER-treated sports injuries useful for total counts, while OrthoMiami’s review of injury-heavy activities shows how broad the category can be.
In recent US summaries, sports and recreation injuries total in the millions each year. For college sports, the overall injury rate has been reported around 9.2 per 1,000 athlete exposures. Football games sit much higher than that. By contrast, basketball often piles up injuries because so many people play it year-round.
Bottom line: football usually looks worst by injury rate, while basketball, cycling, and gym exercise often create the biggest injury totals.
A quick disclaimer, because it matters: injury risk changes with age, skill level, rules, protective gear, coaching, and training habits.
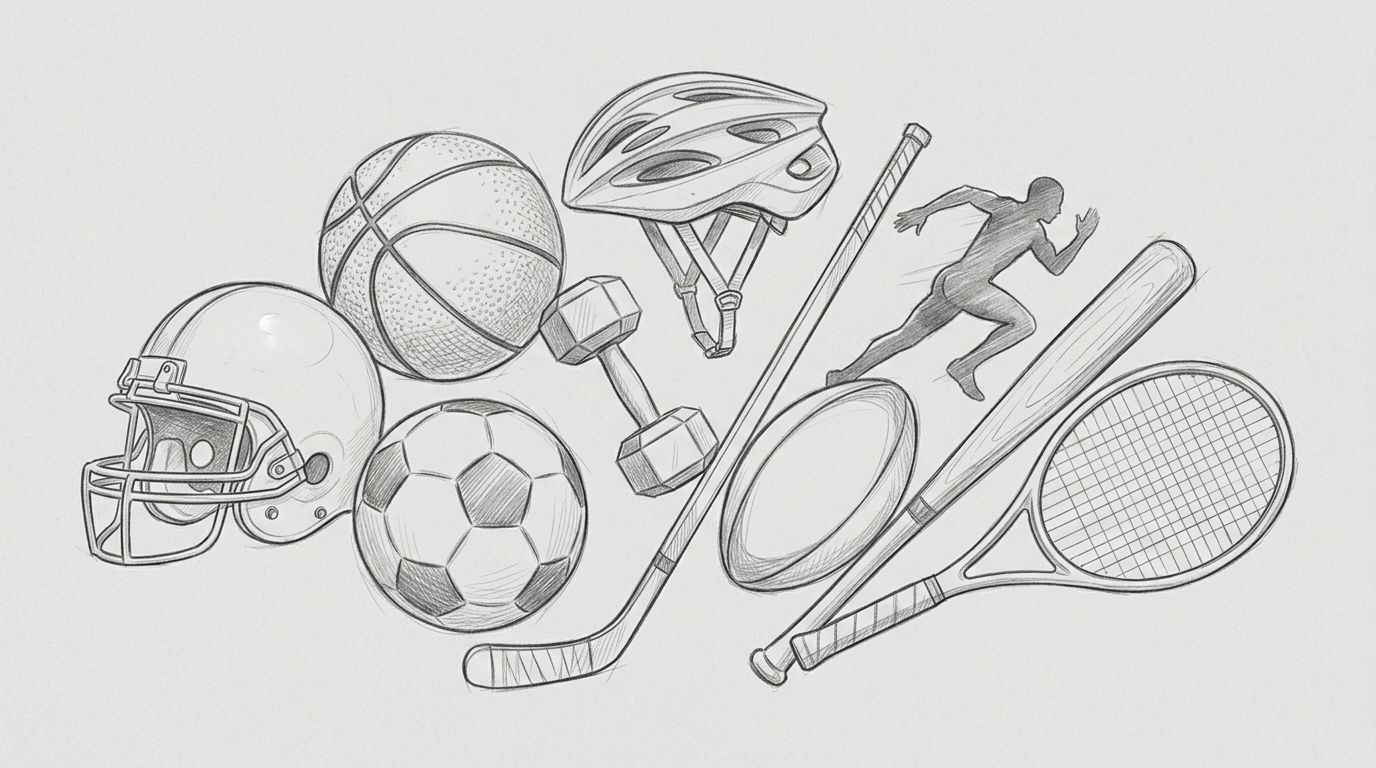
Top 10 sports with the most injuries
This ranking blends recent US injury totals with rate-based findings. I’m also including exercise because many injury databases track it beside sports. If I limited the list to traditional sports only, everything below it would move up one spot.
Here’s the quick side-by-side view.
| Rank | Sport or activity | Why it ranks high | Common injuries |
|---|---|---|---|
| 1 | Exercise, gym workouts | Very high ER totals, huge participation | Strains, sprains, back injuries, fractures |
| 2 | Basketball | Massive participation, jumping and quick cuts | Ankle sprains, finger dislocations, ACL tears, concussions |
| 3 | Football | Highest collision load, very high rate in games | Concussions, knee sprains, ACL tears, fractures, dislocations |
| 4 | Cycling | Frequent ER visits, speed plus hard falls | Fractures, wrist injuries, concussions, road rash |
| 5 | Baseball and softball | Popular with kids, throwing stress and ball impact | Shoulder overuse, elbow pain, fractures, facial injuries |
| 6 | Soccer | Big numbers, nonstop running and sharp pivots | Ankle sprains, ACL tears, hamstring strains, concussions |
| 7 | Lacrosse | Fast play with contact, sticks, and ball strikes | Concussions, sprains, fractures, shoulder injuries |
| 8 | Skiing and snowboarding | Speed, falls, and awkward landings | Wrist fractures, knee injuries, shoulder dislocations |
| 9 | Pickleball | Rapid growth, many fall-related injuries | Wrist fractures, Achilles tears, strains, head injuries |
| 10 | Golf | Lower trauma risk, but lots of repetitive stress | Low back pain, elbow tendinopathy, wrist strain |
If I narrow the lens to organized sports, basketball and football are the two names I keep seeing near the top. Basketball creates a lot of injuries because participation is so broad. Courts are everywhere, games are frequent, and ankle sprains happen fast.
Football is different. Its total volume is high, but its injury rate is what really stands out. In college play, game injury rates have been reported around 36 injuries per 1,000 athlete exposures. That is why football often wins the unwanted title of most dangerous by rate, even when another activity logs more ER visits overall. For more context, I also found this comparison of rate versus severity helpful.
Cycling earns a high spot for another reason. Speed turns simple mistakes into hard falls. A bad landing can mean a fractured wrist, a broken collarbone, or a concussion in seconds.
Then there are the sports that mix volume with movement risk. Soccer and lacrosse both involve sprinting, sudden cuts, and body contact. That combination raises the odds of knee injuries, sprains, and head trauma. Meanwhile, baseball, softball, and golf show that a sport doesn’t need heavy contact to hurt people. Repetition alone can wear down elbows, shoulders, and backs over time.
What these sports injuries have in common
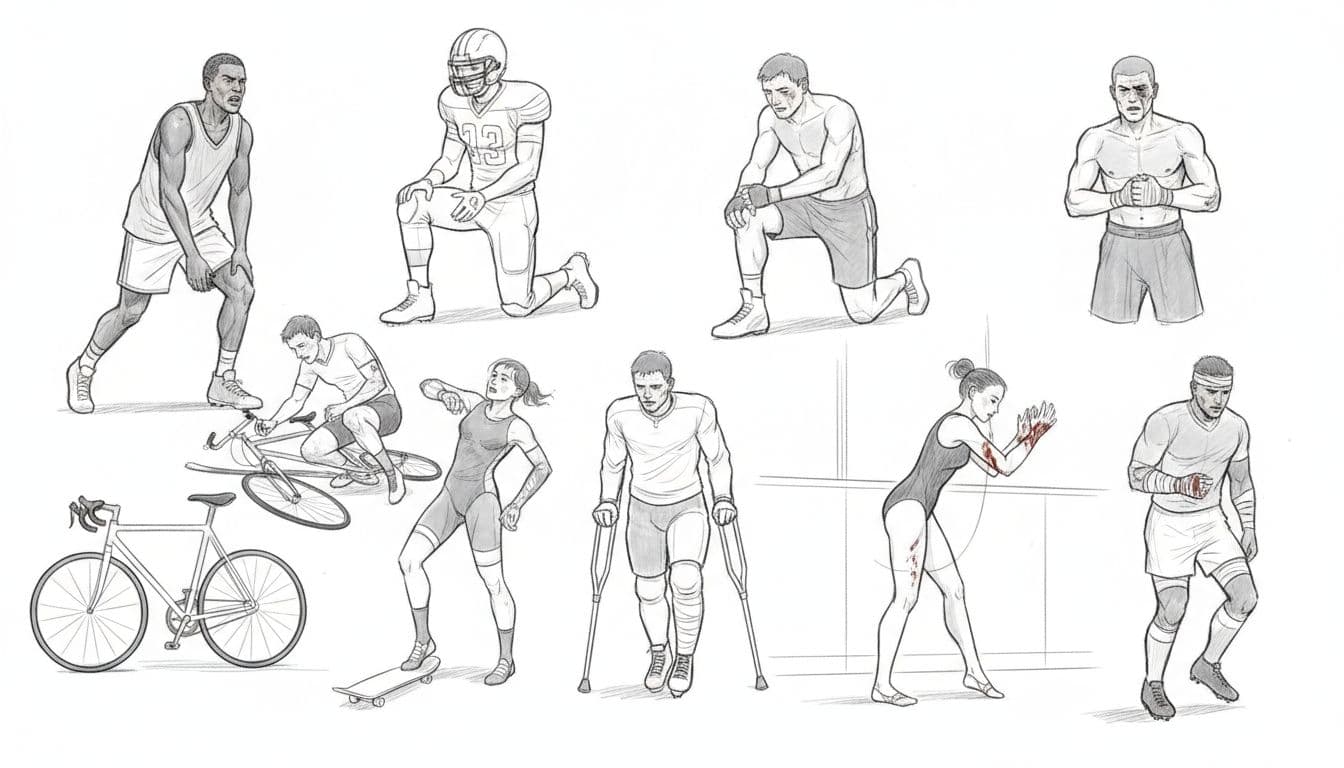
When I step back, most sports injuries come from four things: contact, cutting, falling, and repetition. Football and lacrosse lean hard on contact. Basketball and soccer punish knees and ankles with fast direction changes. Cycling, skiing, and pickleball bring fall risk. Baseball, softball, golf, and even gym workouts often cause overuse problems.
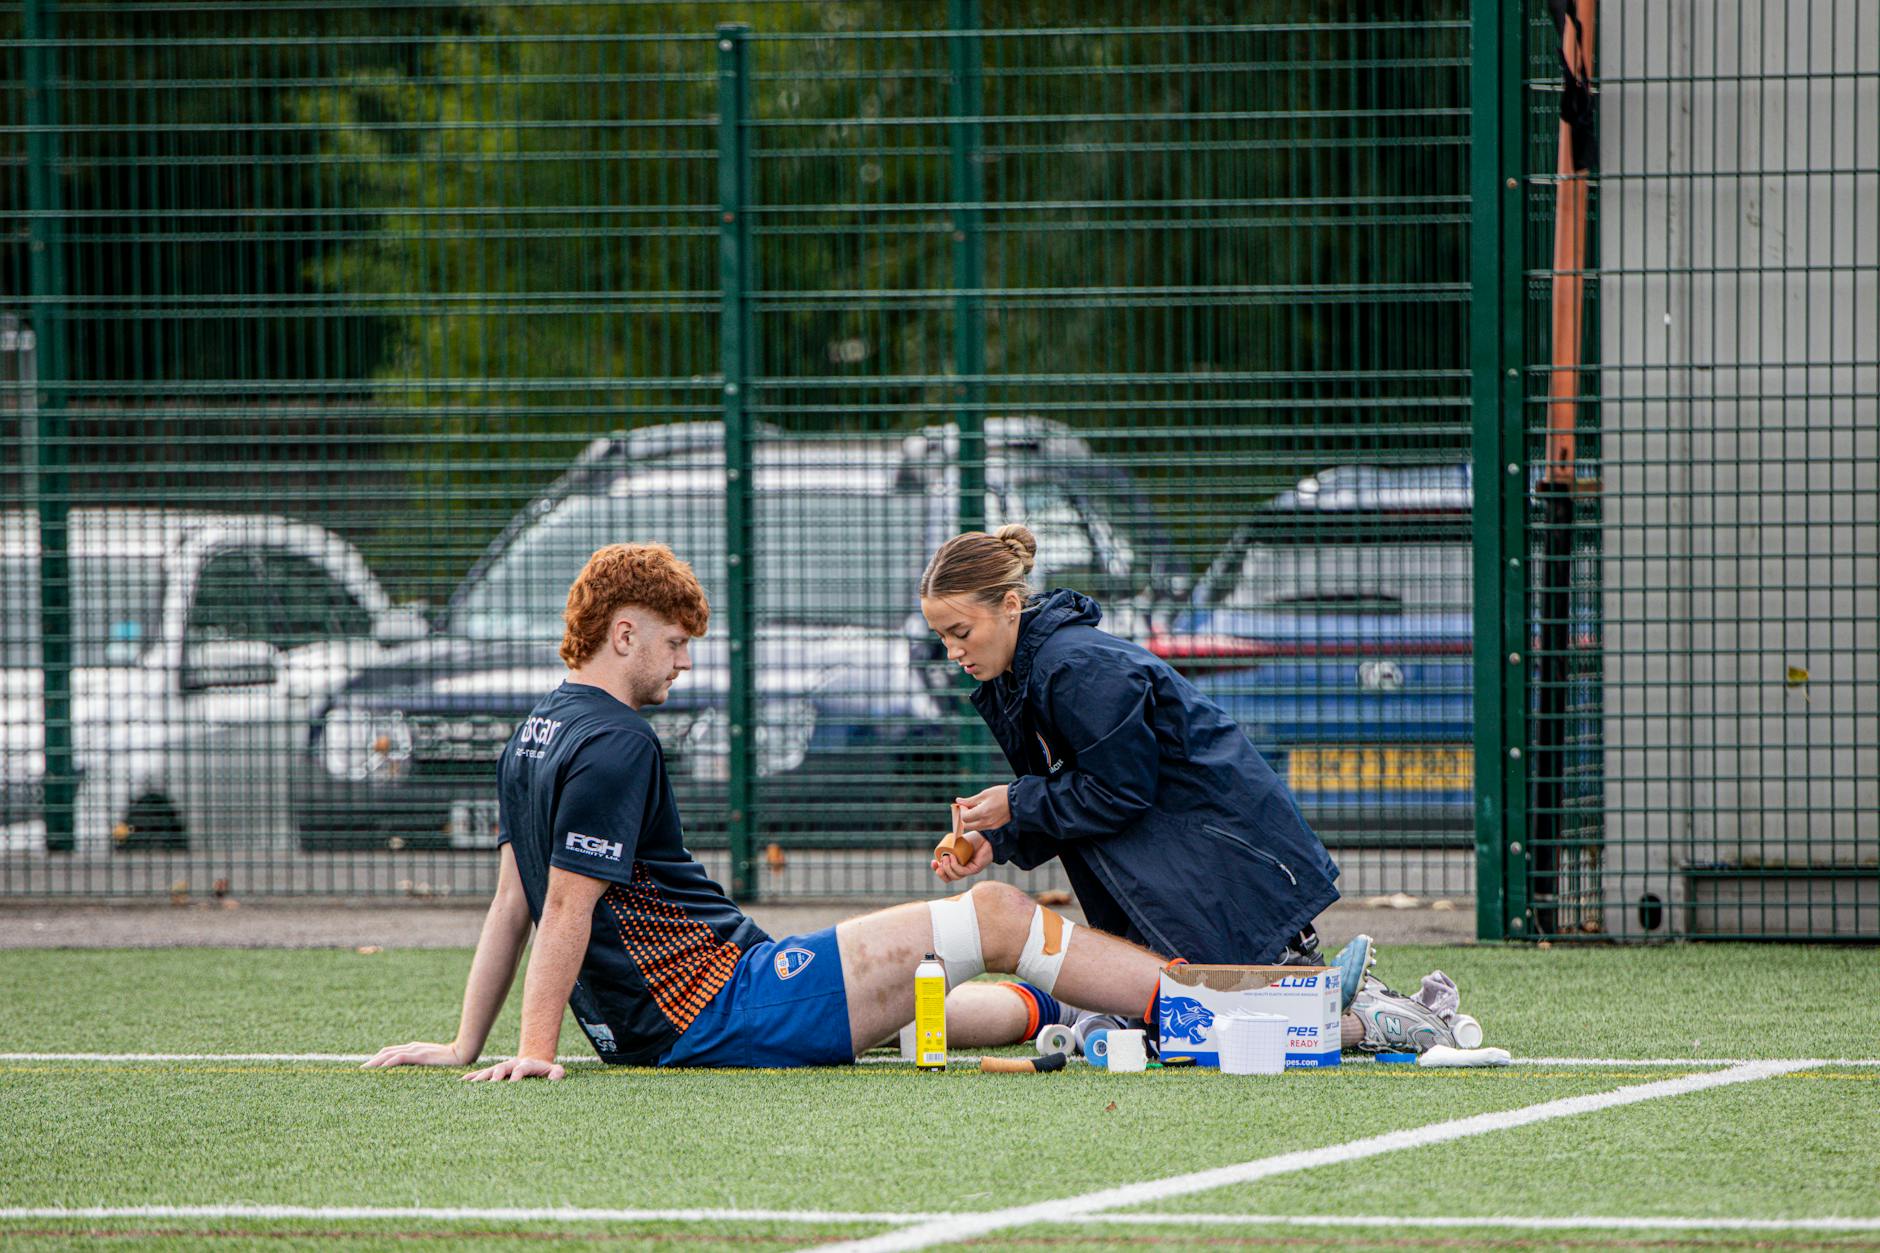 Photo by Ollie Craig
That pattern also points to prevention. I can’t remove risk, but I can lower it with strength work, warmups, proper shoes, sport-specific technique, and enough rest between hard sessions. For concussion risk, early reporting matters. For ACL tears, hip and leg strength helps. For overuse injuries, workload control is huge. Pain is often the warning light on the dashboard, not something to push through for weeks.
Conclusion
If I answer the question in one sentence, football usually has the highest injury rate, while basketball, cycling, and gym exercise often produce the most total injuries. That may sound like a small distinction, but it changes the whole ranking. Once I separate rate from volume, the top 10 makes much more sense, and so does injury prevention.